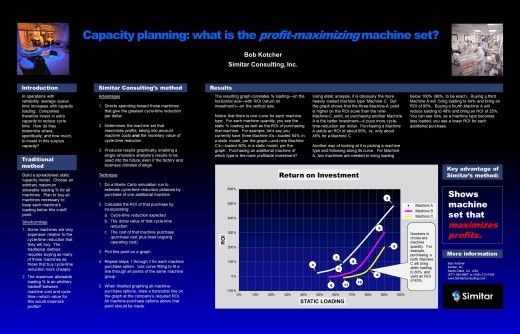
Simitar created this tool that it calls an ROI-Loading graph, or “ROIL” graph, and was invited to show it in the 2011 Winter Simulation Conference—the premier international conference for system simulation. The tool displays results of multiple dynamic capacity analyses on a single graph. Managers and engineers carrying this tool will have capacity answers always available.
Here is a graphic with instructions on how to construct the tool:
The full paper on this method follows. Read more ›


 Loading